原文链接 https://lingxiankong.github.io/2016-11-07-horizon-resource-usage-overview.html
注:以下为加速网络访问所做的原文缓存,经过重新格式化,可能存在格式方面的问题,或偶有遗漏信息,请以原文为准。
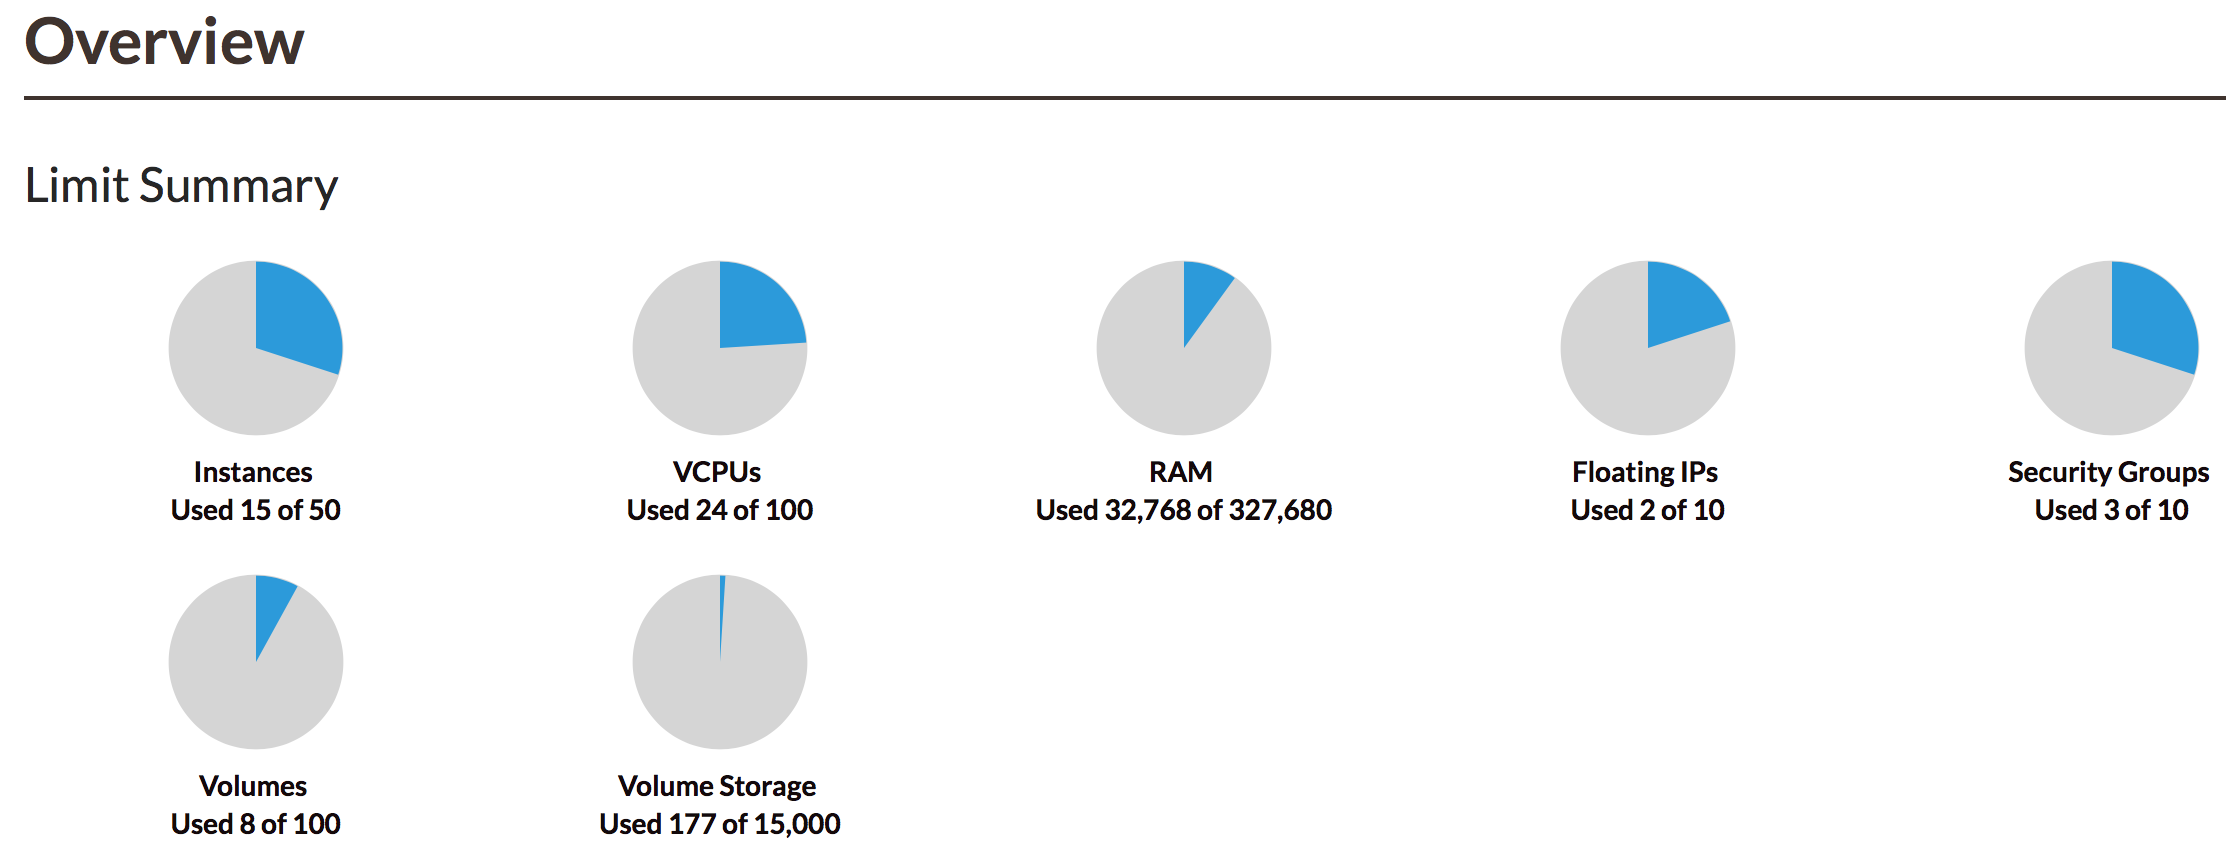
In 'Project'->'Compute'->'Overview' pannel of Horizon, a common user can see some OpenStack resources usage information in 'Limit Summary' table in pie chart. By default, that includes 'Instances', 'VCPUs', 'RAM', 'Floating IPs', 'Security Groups', 'Volumes' and 'Volume Storage'. Horizon will get usage of those resources from Nova, Cinder, Neutron respectively.
An sample picture of resource overview in Horizon:
Nova
Usage of resources like 'Instances', 'VCPUs', 'RAM' is coming from Nova. You can see the usage information by running following nova command:
lingxiankong@lingxiankong-pc:~$ nova limits
+------+-----+-------+--------+------+----------------+
| Verb | URI | Value | Remain | Unit | Next_Available |
+------+-----+-------+--------+------+----------------+
+------+-----+-------+--------+------+----------------+
+--------------------+-------+--------+
| Name               | Used  | Max    |
+--------------------+-------+--------+
| Cores              | 24    | 100    |
| FloatingIps        | 0     | 25     |
| ImageMeta          | -     | 128    |
| Instances          | 15    | 50     |
| Keypairs           | -     | 50     |
| Personality        | -     | 5      |
| Personality Size   | -     | 10240  |
| RAM                | 32768 | 327680 |
| SecurityGroupRules | -     | 400    |
| SecurityGroups     | 1     | 50     |
| Server Meta        | -     | 128    |
| ServerGroupMembers | -     | 10     |
| ServerGroups       | 0     | 10     |
+--------------------+-------+--------+
So, you can see the information of 'Cores', 'Instances' and 'RAM' from the output is the same with what you see from Horizon.
The code in Horizon calling Nova:
novaclient(request).limits.get(reserved=False).absolute
On Nova server side:
- The resource limit value(max) comes from
hard_limitfield ofquotastable in the database, if no limit is found for a given resource and project, default values for quota limits are specified in configuration. - The used resource value comes from
in_usefield ofquota_usagestable, e.g.select sum(in_use) from quota_usages where project_id='68ba465577ec41069b54e71378d9b43b' and resource='instances';
NOTE: If Neutron is deployed and used as Network service, the usage of 'security group' and 'floating ip' should come from Neutron instead of Nova.
Cinder
Usage of resources such as 'Volumes' and 'Volume Storage' is coming from Cinder. You can see the usage information by running following cinder command:
lingxiankong@lingxiankong-pc:~$ cinder absolute-limits
+--------------------------+-------+
|           Name           | Value |
+--------------------------+-------+
| maxTotalBackupGigabytes  |  1000 |
|     maxTotalBackups      |   10  |
|    maxTotalSnapshots     |  300  |
| maxTotalVolumeGigabytes  | 15000 |
|     maxTotalVolumes      |  100  |
| totalBackupGigabytesUsed |   0   |
|     totalBackupsUsed     |   0   |
|    totalGigabytesUsed    |  177  |
|    totalSnapshotsUsed    |   1   |
|     totalVolumesUsed     |   8   |
+--------------------------+-------+
The code in Horizon calling Cinder:
cinderclient(request).limits.get().absolute
The quota management code on Cinder server side was copied from Nova originally, so the basic logic is similar, you also need refer to quotas and quota_usages table for block storage usage information.
Neutron
Usage of resources such as 'Floating IPs' and 'Security Groups' is coming from Neutron. You can see the usage information by running following neutron command:
lingxiankong@lingxiankong-pc:~$ neutron quota-show
+-----------------------+-------+
| Field                 | Value |
+-----------------------+-------+
| floatingip            | 10    |
| ikepolicy             | -1    |
| ipsec_site_connection | -1    |
| ipsecpolicy           | -1    |
| network               | 150   |
| port                  | 600   |
| rbac_policy           | 10    |
| router                | 10    |
| security_group        | 10    |
| security_group_rule   | 100   |
| subnet                | 150   |
| subnetpool            | -1    |
| vpnservice            | -1    |
+-----------------------+-------+
You probably found the output just only contains the limit number of each resource in Neutron, but lack of used information. Yes, Neutron currently doesn't provide API to get how many resources already used for the tenant. In order to get that information, you have to specificly query the resource by running:
lingxiankong@lingxiankong-pc:~$ neutron floatingip-list
lingxiankong@lingxiankong-pc:~$ neutron security-group-list
Then you can count the number of used resources according to the output.
The code in Horizon calling Neutron:
neutronclient(request).show_quota(tenant_id)['quota']